Clarifying Data Governance: What is a Business Glossary, a Data Dictionary, and a Data Catalog?

I often see conflicting and overlapping definitions of business glossaries, data dictionaries, and data catalogs, and consensus of standard definitions of each remain elusive.  Some of this confusion is easily understood considering how data governance typically evolves within an organization. For instance, it can be efficient to start with the creation of a data dictionary or data catalog and subsequently build a data governance program on top of that; likewise for a data quality initiative.  This approach delivers quick wins in data governance while embracing the spirit of ‘agile’.  I will put forth the following as the suggested definitions and elements of each.   My intent and emphasis is to capture the joint value of these assets, to provide specific definitions of each, explain how they fit into a data governance program, and provide examples of each.

Summary of Business Glossary, Data Dictionary, and Data Catalog

Business Glossary

A business glossary is business language-focused and easily understood in any business setting from boardrooms to technology standups. Business terms aren’t meant to define data, metadata, transforms, or locations, but rather to define what each term means in a business sense. What do we mean by a conversion? A sale? A prospect? These types of questions can be answered with a business glossary. Having a business glossary brings common understanding of the vocabulary used throughout an organization. The scope of a business glossary should be enterprise-wide or at least divisional-wide in cases where different divisions have significantly different business terminology. Because of the scope and the expertise needed, responsibility for the business glossary is owned by the business rather than by technology. Often a data steward or business analyst will have this as a sole responsibility.

Data Dictionary

A data dictionary should be focused on the descriptions and details involved in storing data. There should be one data dictionary for each database in the enterprise. The data dictionary includes details about the data such as data type, permissible length, lineage, transformations, and so on. This metadata helps data architects, engineers, and data scientists understand how to join, query, and report on the data, and explains the granularity as well. Because of the need for technical and metadata expertise, the ownership responsibility for a data dictionary lies within technology, frequently with roles such as database administrators, data engineers, data architects and/or data stewards.

Data Catalog

The data catalog serves as a single-point directory to locate information and it further provides the mapping between the business glossary and data dictionaries. The data catalog is an enterprise-wide asset providing a single reference source for location of any data set required for varying needs such as Operational, BI, Analytics, Data Science, etc.. Just as with the business glossary, if one division of an enterprise is significantly different than others, it would be reasonable for the data catalog to be exclusive to the division rather than to the enterprise. The data catalog would most reasonably be developed after the successful creation of both the business glossary and data dictionaries, but it can also be assembled incrementally as the other two assets evolve over time. A data catalog may be presented in a variety of ways such as enterprise data marketplace. The marketplace would serve as the distribution or access point for all, or most, enterprise certified data sets for a variety of purposes. Because of the mapping work requiring involvement from both business and technical expertise, assembling the data catalog is a collaborative effort.

Business Glossary, Data Dictionary, Data Catalog

Summary

Of course, the success you realize from the assembly and use of these data governance assets is entirely dependent on other pillars of a solid data governance program such as a data quality initiative, master data management, compliance and security concerns, etc. Please share your thoughts in the comments section or by direct message.

Dirk Garner is Principal Consultant at Garner Consulting providing data strategy consulting and advisory services.  He can be contacted via email:  dirkgarner@garnerconsulting.com or through LinkedIn:http://www.linkedin.com/in/dirkgarner

See more on the Garner Consulting blog: http://www.garnerconsulting.com/blog-busglossdatadictdatacat.html


The Top 3 Business Drivers for Data Virtualization

• Data virtualization offers best-in-class data integration capabilities to accelerate your analytics, data science and BI initiatives.
• Data virtualization empowers businesses through rapid data discovery, unified data access and the efficiencies of collaborative analytics.
• Data virtualization unleashes the power of self-sufficiency for business analysts and power-users to create as-needed custom views that display information precisely as they’d like for each unique business initiative.
• Data virtualization can save countless hours by eliminating typical roadblocks such as difficult-to-access data, funding for lengthy ETL projects, and the headaches of informal and inconsistent analytics calculations based on siloed data within organizations.
• Data virtualization provides these capabilities by abstracting and simplifying the complexity of locating, joining and filtering multiple simultaneous data sources. Even complicated transformations, cleansing and aggregations can easily be performed through a visual interface without the need for advanced SQL development skills.

Introduction to Data Virtualization

Many organizations face data integration and accessibility challenges as they seek to deliver ever-increasing amounts of data into the hands of more people for exploration and analysis. Data virtualization is an approach and set of technologies and practices to address these challenges and to empower organizations with data. Though data virtualization is not new, or without its complexities, businesses stand to gain value and efficiencies through adoption. Specifically, three primary capabilities are driving businesses towards data virtualization: data unification, business agility and synergies with data governance.

• Enabling discovery for enterprise analytics by providing a single repository to access, manipulate and leverage enterprise information assets through data unification
• Agility in data exploration and discovery accelerates time to insight
• Data virtualization is an effective catalyst for data governance by minimizing redundant and repetitive efforts and driving standardization of KPIs, metrics and reports – improving confidence in the quality and accuracy of the underlying data.

Enabling Discovery through Data Unification – Quick and Efficient Data Access

Data virtualization provides the crucial function of unifying data sources that centralizes access through a single location. Data unification is the process whereby multiple disparate data sources are made accessible from one location without the need for physical data integration, copying or moving data. This approach quickly creates a single repository in which analysts can explore, discover, and query the entire depth and breadth of enterprise information.

By unifying data sources where they exist (rather than copying data to a central location) multiple disparate data stores can be integrated – regardless of geographic location and without delays caused by copying data. Because of this, data virtualization accelerates and empowers data science, business analytics and business intelligence functions by increasing the breadth of data availability, which in turn empowers self-sufficiency.

Data virtualization improves time to business insight by placing all enterprise data at the fingertips of users, including non-traditional data types such as unstructured data, clickstream, web-originated or cloud-based data. Regardless of the existing infrastructure (i.e., a data warehouse, data lake, or data that is currently spread across multiple isolated data silos), data virtualization creates an environment that helps bring everything together now and in the future when new data stores and sources are added.

Business Agility & Collaborative Analytics – Reusability, Consistency, Self Sufficiency

By reducing the analyst’s dependency on IT for data acquisition and data preparation, data virtualization enables self-sufficiency and therefore, agility. Data virtualization makes it possible for business analysts to manipulate data on-the-fly, iterating through multiple perspectives in real time without the need to copy or move the data. This dynamic view creation makes it possible to rapidly prototype, experiment, and iterate to see, manipulate and use the data exactly as needed to meet each unique requirement. No time is wasted to physically cleanse, remodel, prepare, move or copy the data when using data virtualization. These functions are carried out in real time, as needed, and can be quickly and easily modified to meet the needs of each unique data-driven effort. This can save a tremendous amount of time by creating queryable virtual joins in minutes.

Data Virtualization as a Data Governance Catalyst

Through intelligent sharing of information, data governance greatly improves productivity and efficiency of analytical, BI and data science initiatives. Searchable data catalogs, standardized metrics and KPIs, data quality improvements, and master data management (MDM) solutions, are just a few examples of the attainable value through of a well-crafted data governance plan.

Data virtualization makes data governance more efficient and streamlines administration through centralization of data policies and administrative tasks. Since data virtualization integrates data in real time, leaving data in place and eliminating the need for redundant data copies such as staging areas and operational data stores (ODS), there are fewer areas to govern and secure, meaning less administration, less complexity, and less risk. Data governance measures can be applied on-the-fly as data flows through the virtual layer. The centralized nature of governing the data and access through a unified data layer eliminates the need for redundant steps, interfaces, procedures, and the need to examine and audit each individual data source is lessened or removed altogether.

Having a single security and access model to manage and maintain across all data sources greatly simplifies all facets of data security management by providing a single platform for administration rather than needing to juggle the many administrative applications corresponding to each individual data storage server. Data policies can be defined on a shared/common data model or on logical data objects for efficient sustainable management and reuse.

Summary

One or more of these drivers will generally resonate so strongly within an organization that they will pursue the value of data virtualization to meet those specific needs. This generally leads to further leveraging the power of data virtualization in pursuit of additional value through other business drivers for data virtualization as the platform, team, and community mature. Data Virtualization products such as those available from Red Hat JBoss, Stone Bond Technologies, and Data Virtuality, stand out among the crowd as some of the more innovative approaches to Data Virtualization.

Dirk Garner is Principal Consultant at Garner Consulting providing data strategy and advisory services.  He can be contacted via email:  dirkgarner@garnerconsulting.com or through LinkedIn:http://www.linkedin.com/in/dirkgarner

Denodo DataFest 2016 – Event Report

Event Background
Denodo’s DataFest 2016 (#DenodoDataFest) certainly delivered to its theme of ‘Rapid, Agile Data Strategies for Accelerating Analytics, Cloud, and Big Data Initiatives’. The conference was held on October 18th in the San Francisco Bay area close to Denodo’s Silicon Valley-based US headquarters with each session simultaneously webcast providing attendees flexible options for participation.

Denodo Data Fest 2016 - Angel Vina, CEO, Keynote

Keynote
Angel Vina, Denodo CEO, delivered the opening Keynote entitled Propelling Data Into the New Age. Vina said that Denodo makes the ‘any’ in anything a reality. Denodo handles data of any type, from any place, at any speed, handling any query, and serves any data consumption preference. He contrasted Denodo from Extract-Transform-Load (ETL) processes stating that Denodo is a no-ETL solution and because of this Denodo promotes agility and flexibility. ETL historically reduces agility, flexibility, and simplicity and is generally associated with long development periods and high costs. Vina went on the record stating that Denodo is fully committed to supporting cloud and big data technologies as can be seen in the new capabilities included in the two major and 8 minor releases over the last two years. Vina closed his keynote by declaring that Denodo is the right partner for your organization’s transformational journey.

Session Highlights
During the first customer-led presentation, Josh Wise, Enterprise Architect with Intel, spoke of the long road to their Denodo implementation and how it has evolved into a horizontal service offering within IT that experiences double digit usage growth year over year. Wise also spoke of Intel’s use of the Logical Data Warehouse design pattern and how the re-usable shared views provide convenience and efficiency for the business users.

Next we heard from Larry Dawson, Enterprise Architect from Asurion, who spoke of their journey with Denodo. Dawson estimates that analysts and others are completing their data integration efforts three times faster than prior to investing in Denodo. That 3x productivity boost is quite impressive but Dawson also mentioned the ease with which the Denodo installation was completed saying it was the smoothest launch of an enterprise product he’s seen.

Tim Fredricks, Enterprise Data Architect at VSP Global, described how, using Denodo, VSP Global was able to remedy a failed Master Data Management (MDM) effort by virtualizing the data mastering of five of VSP’s companies. VSP first tried to master these five company’s data without Denodo, choosing to build ETL jobs and synchronize data across each of the five organization’s databases using bi-directional ETL jobs running to/from each of the other four company’s corresponding databases. Once this approach failed, VPS installed Denodo and now each data elements is moved no more than twice in order to bring all five companies into sync in a supportable, maintainable manner.

We later heard a product feature updates from Alberto Pan, CTO for Denodo, who also mentioned that we can expect a beta version of v7 in the second quarter of 2017. Suresh Chandrasekaran Sr. Vice President at Denodo, gave us a glimpse of an “Enterprise Data Marketplace”, which is a shopping-cart type data selection experience developed internally at a Denodo client demonstrating just how well Denodo enables innovation and agility.

Conclusion
In the absence of the Cisco Data & Analytics conference this fall and considering the success of the Denodo DataFest, it seems as if a torch has been passed from vendor to vendor, further strengthening the growth and maturity of data virtualization as a business-accelerator, a technology capability, and a modern architectural pattern.

Virtual Data Building Blocks

Data Virtualization provide numerous opportunities for productivity gains and effort reduction especially in the case of using virtual data building blocks.

Creating and sharing virtual data building blocks is a terrific way to save your analysts’ time by reducing duplicative and redundant effort. These building blocks also serve to standardize how KPIs and metrics are calculated within your organization and provide the means for any analyst to use prepackaged datasets to streamline their efforts and ensure consistent data quality and accuracy.

The idea of the virtual data building blocks is to create different types of virtual views that can be stacked as needed to quickly serve new initiatives with minimal additional development time. There are three suggested types of virtual views in this approach: macro, filtering, and micro level virtual views.

At the macro level you would build broad re-usable views without filtering that can be used as a base layers for more specific needs. So, for example, for website traffic you might build a virtual view that contains all web traffic from all devices and for all purposes on all dates. It is unlikely you would ever need to query that view directly because of its broad scope but building it as a foundational layer provides a starting point for anyone wanting to analyze any aspect of traffic.


Virtual Data Building Blocks

On top of the macro view layer you would then create filtering virtual views as needed. In our example of web traffic a filtering view might be all product browsing traffic. Another example might be purchase conversions, by landing page, by device. Filtering views can be easily re-used when similar specific data subsets are needed.

An initiative-specific micro view layer would sit on top of the filtering layer which sits on top of the macro layer. The micro layer joins across one or more filtering layers and can apply additional filters and aggregations so that only the desired data for a specific initiative is presented. This micro layer serves data visualization, data discovery, BI, and many other use cases precisely. These views can be shared and re-used but are less likely to have broad audiences like the Macro and Filtering layers will have.

Dirk Garner is a Principal Consultant at Garner Consulting providing data strategy consulting and full stack development. Dirk can be contacted via email: dirkgarner@garnerconsulting.com or through LinkedIn: http://www.linkedin.com/in/dirkgarner

Evolved Data Warehousing: A Hybrid Data Warehouse Overview


Hybrid Data Warehouse

It seems that the future of data warehousing resides in the cloud or at the very least will be strongly dependent on cloud capabilities. Offerings such as Google Cloud Platform, Azure SQL Data Warehouse, Amazon Redshift, and Snowflake Computing promise reliability, elasticity, scalability, and performance, all take on the routine care & maintenance tasks that can bog down IT staffs.

But what if you have already made great strides and/or significant investments toward an in-house data warehouse and don’t want to lose the time, investment, or momentum of that effort? A strategic direction to consider in this case is a hybrid data warehouse.

A hybrid data warehouse approach can be strategic whether you are building from the ground up or evolving an existing data warehouse. A hybrid approach can accelerate the availability of cleansed, integrated, and analytics-ready data at a fraction of the cost of a traditional data warehouse and can facilitate scaling to accommodate the vast sea of data available through streaming and message based data sources. Partial cost savings comes through reduced need for storage and processing resources, but cost is primarily reduced through the significantly reduced labor required to prepare and present data for analytics.

Data Warehouse Status Quo
Before delving into the hybrid approach let’s baseline a definition of a traditional Data Warehouse. A traditional Data Warehouse is generally stored in a row based RDBMS technology using a star or snowflake schema. The data is physically copied from sources systems through ETL jobs and most likely transformed from a third normal form schema. These Data Warehouses are generally focused on reporting (black & white, row & column), monitored and measured by workload (CPU, memory, disk space, and network utilization), and may include cubes, or participate in Master Data Management (MDM).

A traditional Data Warehouse was typically created to serve specific reporting requirements with specific data from specific sources systems. Additional data is generally on-boarded through new ETL-based projects depending on available funding, requirements, and development resources. Often there is some drill down capability for specific business needs but the row based technology prohibits untethered exploration due to the need for indexing in a row based data store.

Issues Forcing Us to Evolve this Approach
There are often resource and security policies governing when and how queries can be run and if data can be copied out of the EDW for additional analysis or data blending.

Since it is difficult to define the value or intent of data mining, exploration, and discovery efforts, these efforts are rarely funded leaving a critical gap in data analysis capabilities.

In some enterprises there is no central data warehouse but instead there are data marts created and used for each business function or unique purpose. Although this approach allows more flexibility for the individual business functions, the business is handicapped without the ability to view any part of their business with a comprehensive 360 degree view and these data marts are typically not reusable for other groups.

The inability to handle large data sets and/or semi-structured data prohibits analytical access to some large and relevant data such as social trends & sentiment, log data, and click stream data, which prohibits countless opportunities to find insight that could improve revenue, cut costs, or drive innovation. You are likely to lose competitive advantage without the ability to analyze or act on real-time events and without self-serve analytics capabilities.

Finally, future additional data onboarding in a traditional data warehouse is costly & lengthy and you will be left with slow performance for any report or query for which the data was not specifically modeled and/or optimized to serve.

So What Can We Do?
Wherever you are in your data warehouse journey the typical end goal is near-real-time access to fully integrated, de-siloed, cleansed and modeled data to best empower and inform the business through reports, analytics capabilities, and visualizations.

So, how can we load and integrate data quickly while optimizing for data mining, analytics, and visualizations without additional delay? How can we handle multiple data types and growing data volume and still deliver fresh data rapidly and with high performance? How can we provide a unified 360 degree view of the various aspects of our businesses?

Envisioning a Hybrid Data Warehouse
The simple answer is to assemble a complimentary suite of data management capabilities including robust back end tools to ingest, store, cleanse, and serve data as rapidly as possible, and also provide self-serve front end tools to enable the business to easily explore, discover, and mine data for relevant insights.

Traditionally we were forced to choose a data warehouse approach of either distributed or centralized approach however with today’s technology we can provide centralized data access while leaving data stores distributed as they are. This approach allows us to leave the data stores ‘as-is’ but still provide centralized access.

Some Data Warehouse data stores will likely still be necessary but should be chosen to fit the purpose. For example, there is no longer a need to include a row based data store for reporting and analytics when there are affordable performant column stores that can store the same data modeled in the same way and can perform faster and that require less support.

By unifying data sources rather than copying data to a central location we can integrate multiple data stores including RDBMS, columnar, NoSql, flat files, web services, etc. Data Virtualization provides this crucial function of unifying data sources in order to centralize access through a single accessible location. DV also expedites data integration, remodeling, transformation, and cleansing on the fly without costly or slow ETL work. This allows us to build virtual or logical data warehouse quickly and easily which can be shared, reused, and maintained with minimal effort. Further, the semantic naming capabilities of a Data Virtualization platform simplifies data access with friendly naming and can serve data governance initiatives.

Finally a hybrid data warehouse should be query tool agnostic allowing each individual analyst or group the choice to use the tools that are best fit for the purpose at hand and/or the tools they are most comfortable and productive with using.

The are several advantages of a hybrid approach over a traditional approach:
• Ability to ingest, process, and analyze streaming data
• Empower business users to explore, discover, and self-serve
• Greatly improve performance of integrated data
• Quicker availability of currently inaccessible data
• Ability to store large data sets and semi structured data
• Provide single source gateway for access to all data

Components of a Hybrid Data Warehouse
So how do we do we make all of this reality? To start with, I would prescribe a minimum of the following core capabilities for a hybrid data warehouse that will be scalable, extensible, and upon which your business can grow for the foreseeable future.

Columnar Data Storage
The value of column stores is in delivering high performance data retrieval with minimal human optimization. Fast data retrieval performance can lend significant advantage to analysts performing exploration and discovery functions and can also lessen adoption concerns. Prior to columnar stores technology teams would need to index row based data stores in order to provide adequate performance for analyst’s queries. This required that technology knew ahead of time what queries the business would run to provide sufficient time to optimize the data store to respond to those queries in an acceptable timeframe. This strategy works fine for static reporting wherein the optimization work has been completed. The report performs predictably well consistently into the future. However, outside of static reporting, this causes a slow cycle of analysis wherein the business analyst would ask a question of the data in the form of a query get the resulting answer, review the results and generate a new query based on any number of factors such as instinct, specific business questions, curiosity, etc. The analyst would then make a request to the technology team to index for the new query which may take hours, days, or weeks depending on team bandwidth and the delivery process. Conversely, a robust columnar store such as Vertica or Par Accel can optimize data automatically without the need for human indexing. For technology, there is no guessing what questions the business will ask. For the business there is no waiting for technology to index the data for your next query. By leveraging columnar data stores an analyst can ask a question, get an answer, ask another question, get another answer and so on. The analyst can pursue insight as fast as (s)he can think and type, instead of as fast as technology can index. This allows analysts to have a conversation with the data rather than technology.

Please note that I have not included row based any RDBMS as a required core component of a data warehouse. The reasoning for this is that in the event you are building from the ground up, you really will not need row based data stores. By leveraging columnar stores for relationally modeled data you will be automatically delivering the performance and maintenance advantages of columnar storage as listed above at a similar cost to investing in row based technology. However, in the event that you already have row based RDBMS there is no reason to abandon it unless that is a specific intention. You can continue to use your traditional EDW, or other row base store albeit with the legacy performance drawbacks. You can leverage the capabilities of other technologies in this list to augment the row based technology and work-around the legacy issues.

NoSql
There are numerous NoSql (not only SQL) data store options filling as many purposes and use cases: Hadoop, Cassandra, MongoDB, CouchBase, Neo4J, etc. The advantages of the NoSql data stores is multifold and differs with each platform but the most common use cases include storing unstructured or semi structured data at low cost, creating a data lake analytics environment, providing different types of visualization capabilities such as graph analysis, and so on.

Streaming Data & Message Queues
It is becoming increasingly essential to provide access to the vast sea of data available from streaming and message based sources such as click stream data, social feeds, enterprise service buses (ESB), etc. The potential for finding valuable insight within these sources is just now being uncovered and having this data available in your data warehouse can provide your data scientists with as many opportunities for insight as their innovative creativity will allow. Technologies such as Flume, Storm, and Kafka can help build a solid ingestion architecture for both streaming and message based data which can then be populated in a data lake of transformed and stored in a relational store.

ETL
Perhaps someday all data will be available via streaming or message queueing but in 2016 we will still need to support flat file and batch data ingestion through an ETL process using products such as Informatica, Ab Initio, or Data Stage.

Data Virtualization
Data virtualization is a key element to a hybrid data warehouse and products such as Composite, Denodo, and DataVirtuality allow analysts to join queries across physically diverse databases of all different types without the extra steps and time delay of traditional ETL. They can also virtually model data, transform data, and provide user friendly data element naming. They operate as an intermediary access point and house only the necessary metadata to allow cross database joins. Many of these platforms include advanced query optimization and caching capabilities to provide a more robust toolset and include such functionality as the ability to scrape web pages and ingest web service data which can then be presented as relational tables.

Key advantages to data virtualization:
-‘Instant’ data accessibility through a unified data layer
-Logical data mart & warehouses: build quickly and without ETL
-Automated ETL via caching functions
-Empower self-guided exploration, discovery, and prototyping
-360 view of anything


Data Unification Layer

Bringing it All Together
Having all available data accessible from a single location alongside traditionally warehoused data allows deep and broad analysis and the ability to query across data sources with the immediacy only possible through data unification eliminating the need for slow and costly data movement.

Near real-time analysis such as client journey and behavior, social trends and sentiment analysis, operational systems efficiency, are powerful capabilities and if leveraged strategically will output invaluable insights, improved behavior prediction, ideal next step recommendations, better service response, improved ROI, lower costs, and much more.

Build, Buy, or Dust Off What You Own?
Do you need to go out and buy several new products? Maybe. You don’t need to buy everything I have mentioned here in order to evolve and extend your data warehouse. And if you do want to add multiple capabilities, you don’t necessarily need to add them simultaneously. But before you look to buy anything new, take a look at your existing technology assets. Some of your existing data management tools may have functionality you may not be aware of, are not currently using, or to which additional functionality will be added soon in an upcoming product update. In some cases you may be licensing a bundled package of products but only using parts of the licensed functionality. If any of this is the case and you do have additional capabilities in-house that you are not currently utilizing, consider whether to move towards the most enabling and empowering technologies versus further leveraging of existing products. Cost and timing are factors in this decision as is choosing products bet fit for your specific needs. A proof of technology process might be helpful to measure the value of each product and balanced scoring could be the difference between a good decision and a poor investment. Any POC is best structured around a few real world use cases to ensure relevancy of outcome, and the ability to provide balanced comparative scoring to support making an informed decision.

Adjuncts
Beyond those core capabilities there are several additional considerations including both technology options and process improvements. Depending on your unique business environment you may want to consider some or all of the following.

A more recent capability that helps accelerate analytical data accessibility is to leverage a massively scalable platform such as MongoDB, Cassandra, or CouchDB to handle your production transactions, store your production data, and also provide analytical access to the data. Unifying these types of data stores through a data virtualization platform provides immediate access to the most recent data and can provide an up-to-the-minute 360 view of anything.

A sandbox environment can support and accelerate analytical exploration and discovery and is a great interim step while working towards a hybrid data warehouse or when exploring data not yet accessible through the data warehouse, data lake, or data virtualization. A sandbox, in this context, is defined as an area in a data store that is separate from, but adjacent to, production data warehouse stores. Analytical group(s) can get full rights to load, create, update, modify, and delete schemas, tables, and data in the sandbox and are assigned read only access to the production data warehouse. This allows the analysts to join queries across sandbox data (data imported into the sandbox) and production data warehouse data without the need to wait for the data warehouse to onboard the data. This serves several use cases such as evaluating whether or not there is sufficient value to onboard the data, or getting a head start on analysis without waiting for a full onboard process to complete.

I have seen both Agile BI and KanBan work very well with BI and analytics projects and initiatives. Agile BI is discussed further here. KanBan is a type of agile development that focuses on a prioritized backlog of work with a funneling approach. As developers complete each story they pull a new project from the backlog and begin development on that initiative. Each story is worked on iteratively and gets released when development and testing are complete. The advantages of KanBan over Scrum is that all of the overhead of scheduling iterations and allocating stories to try to meet specific release dates goes away. The team works at their own pace, without the pressure and mad dashes to release multiple stories simultaneously, and, in theory, each story gets released sooner. In either strategy, periodic and participative retrospectives can facilitate continuous improvement

In-Memory analytics and data stores are gaining in capability and popularity. Although it is debatable whether an in-memory data store offers sufficient value to offset the greater cost when compared to a columnar store I would suggest that in-memory analytics will become more prominent over the next few years.

The promise of temperature based data storage is to provide cost and capacity advantages. By storing the ‘cold’ data that is rarely accessed on the cheapest possible platform possibly archived on tape, CD, etc. Storage costs can be minimized. ‘Warm’ data is more frequently used but not so frequently, or with such urgency, as to justify the fastest and most expensive storage technology. ‘Hot’ data is that which requires immediate access at any time and in a performant manner. Joining queries across the different platforms can easily be performed using data virtualization or could be materialized temporarily as needed through caching, data wrangling, parking in a data lake, etc. Products such as Talena provide GUI based configuration and management of selective data archiving and can simplify data pruning and archiving.

Ingestion and Data Prep tools such as Podium, Paxata, and Trifacta can simplify and accelerate the loading & preparation of data for analytics. These drag and drop tools are easy to use for non-technical analyst staff allowing quicker self-serve analytics along with data quality and cleansing functionality.

Beyond the Data Warehouse: Adoption Considerations
Naturally there are several other factors leading to the success of a Hybrid Data Warehouse:

• Staff structure: centralized or distributed analytics functions
• Finding a champion(s) & a stakeholder(s), to foster buy-in
• Appropriate, necessary, and timely training
• Overcoming company cultural roadblocks
• Choosing and using reporting and visualization tools
• Data archiving and pruning

These factors have been discussed in a full presentation of this material that includes more depth on the entire topic as well as depth on these related considerations. The slides for this presentation are available online here and would gladly be discussed personally by contacting the author.

Dirk Garner is a Principal Consultant at Garner Consulting providing data strategy consulting and full stack development. Dirk can be contacted via email: dirkgarner@garnerconsulting.com or through LinkedIn: http://www.linkedin.com/in/dirkgarner

Get There Faster: Evolving Shadow IT into Collaborative IT


Shadow Partners

Shadow IT — The phrase itself causes frustration and rolled eyes in IT groups. Business staffs dislike the stigma attached to the phrase. But what is really meant by ‘Shadow IT’? Why and how does Shadow IT come into being in the first place? Although the answers to these questions are very likely to depend on your unique organizational structure and culture, taking the time to understand the root cause of Shadow IT will indicate if there are larger problems at hand. By understanding the factors that brought Shadow IT into being, the value that it creates, and the pitfalls within, you can lead positive change and drive both innovation and productivity.

Shadow IT is what we call the use of technology products without IT participation and it is generally mired within an adversarial relationship between business teams and IT groups. There are logical reasons for this adversarial environment since technology is likely to feel that the business went behind their backs and the business is likely to be frustrated and disappointed with the lack of previous contributions from IT.

Shadow IT is most often born out of IT’s failure to meet the needs of the business either by lack of resources, lack of delivery, lack of timely delivery, or failure to evolve their capabilities to keep up with the ever-evolving business environment and related needs. Business teams will frequently view IT as an impedance to progress when these negative dynamics exist. The business may not feel that they have sufficient control over their own destiny and are likely to want self-serve capabilities and full access to data in order to empower them to do their jobs.

With unmet needs the business is forced to choose between either going it alone and building Shadow IT systems, which is the best outcome in this case, or the business may choose to do nothing leaving the potential value of missed opportunities drop to the floor.

Shadow IT in itself is not a bad thing for your business. It means that someone is getting the work done somehow. However, the presence of Shadow IT does indicate a problem within your organization. The problem could be as simple as technology teams not having sufficient focus on delivering to meet business needs due to a variety of factors such as being incentivized to keep the lights on and not for enhancing and adding new business capabilities. Whatever the cause there is a greater problem at hand if Shadow IT has taken root at your company.

The single biggest advantage to Shadow IT is the fact that at least someone is engaged and working to deliver solutions to fill business needs and opportunities which can improve revenue, profits, savings, and customer satisfaction. Beyond that, Shadow IT will generally yield a solution more closely aligned with the original business need with less emphasis on technology capabilities and more emphasis on the appropriateness, alignment, and the speed of delivery of the end product. Scheduling is simpler with Shadow IT delivered solutions as there is at least one fewer groups participating in the project therefore there are fewer scheduling constraints.

There is a flip side to all of those advantages however. A common problem associated with Shadow IT is that the end solution is rarely scalable or can be integrated with other systems which make it a one-off solution. Shadow IT teams are generally focused on getting to the end state as rapidly as possible leaving no time to architect a solution with shareable, reusable components. Future related efforts will likely need to be built from the ground up, as opposed to extending the current system, causing duplicate effort and slower delivery of subsequent projects. Conversely, solutions built with shareable, re-usable, componentized architecture allow future project teams to quickly build upon the existing foundation of previous project components. With each new project built in this manner we will be progressively cutting development time and achieving the original desired goal of quicker delivery.

Another potential drawback of Shadow IT is the lack of formal testing and QA efforts which may lead to a lower quality product that may include incorrect data upon which strategy is planned and action is taken. These actions and strategies are likely to be flawed if they are based on inaccurate, partial, or poorly integrated data. Confusion propagates in organizations with multiple Shadow IT groups each of which provides similar deliverables. There are likely to be discrepancies among the results which require troubleshooting and diagnoses to remedy and the entire situation is likely to lead to finger pointing and arguing.

With all of that to consider what should we be working to achieve? An ideal outcome is that Shadow IT delivered solutions be treated as working prototypes from an IT perspective and that IT works to productionalize the end results in a robust, scalable, supportable manner. This collaborative outcome might create an entirely new dynamic between the business and technology. Instead of Shadow IT we would have Partner IT, or Collaborative IT, or Distributed IT. Whatever you might call it, we would surely be better off if these needs were addressed jointly with each group, business, and technology, taking on the work that best suits their background, skills, knowledge, and ability to produce.

Dirk Garner is a Principal Consultant at Garner Consulting providing data strategy consulting and full stack development. Dirk can be contacted via email: dirkgarner@garnerconsulting.com or through LinkedIn: http://www.linkedin.com/in/dirkgarner

App Ubiquity Drives Engagement and Loyalty

Ubiquitous App Experiences

Although mobile use is outpacing the growth of both desktop and tablet a large segment of app audiences, in addition to using their mobile devices, will continue to use desktop PCs and/or tablets at some point in their day such as at work, in the home office, on the couch, etc. For most of us this means that we want 24/7 access to both our work and personal files and apps regardless of where we are and which device we happen to be on at the moment. We also want these files and apps to be in sync so that the changes we make on one device automatically propagate to all of our other devices so we are free to switch devices at will with complete continuity of any work or play in progress. Keeping files in the cloud can handle syncing your personal and work files across devices but can’t do much for the apps and utilities you use or for driving a common experience across devices and operating systems.

Meeting the second expectation, consistency of app experience, is not as easy as meeting the first expectation of file synchronization. App developers will increasingly need to deliver a consistent user experience regardless of device type or OS whether the user is browsing to a web page, accessing a mobile website, launching a mobile app, running a desktop application, connected to the internet, or in an isolated non-connected state. After all, who wants to learn and remember several different ways to do the same things in the same app?

To accomplish this, businesses will need to build versions of their apps for several operating systems such as iOS, Android, Windows, and also for several device types: desktop, tablet, phone, browsers, and watches. Steps need to be taken to allow full functionality whether the device is in a connected or disconnected state and that requires local data stores and some sort of caching and synchronizing strategy. Not only will data need to be stored locally when the device is in a disconnected state, the app will need to sense when it has become connected again and synchronize the data in order to ensure the next session on a different device can be a continuation of the most recent session on the current device.

Building unique versions for each individual operating system and device type causes staff requirements to multiply exponentially. Engineering, QA, product management, and release teams each would need to support multiple operating systems and devices or in the more likely case these teams can only support a single operating system and possibly one or more devices. Because of this there would need to be multiple cross functional teams to deliver to multiple operating systems which leads to higher costs, disjointed user experiences, and siloed & out of sync product roadmaps. Worse yet, the user’s experience is likely to suffer with less cohesiveness among the various platforms and screen sizes, and features available in some versions may not be present in others. All of which reduces user satisfaction and loyalty. One a more consistent user experience comes to market your users are likely to jump ship.

Delivering a common or similar user experience across different device types within the same operating system family is becoming increasingly possible and simpler due to the trend of the major OS developers (Microsoft, Apple, and Google) to consolidate the number of operating systems that run on the various devices and in some cases run the exact same OS on multiple platforms. This furthers businesses ability to deliver seamless cross-device user experience since in some cases the exact same code can run on multiple device types. Microsoft leads the pack in this regard with Windows 10, which runs on desktop, tablet, and phone. Apple is close behind with iOS9 which provides a common OS for tablet, phone, iPod, and watch, but not desktop. Android supports tablet, phone, and watch but the Chrome OS used for notebook computers would need to further converge with Android to include the desktop experience. It appears hopeful that in the near future we will see common operating systems across all device types from all three of the major publishers.

But what about supporting multiple operating systems, I.E. Android, iOS, MAC, Windows? Don’t we still need different dev teams with different skill sets? Fortunately, no. Cross platform development and management tools such as Xamarin, Kony, and Kinvey allow developers to build applications using common coding languages such as C# or Java that run on all three major mobile platforms and their desktop counterparts. By using shared code bases and including ready-built components app development is accelerated and overall quality is improved. Because a single code base can be used across operating systems it is easier and more economical to support several operating systems and multiple device types.

As all of these factors and capabilities evolve and converge we are becoming closer to app omnipresence being an affordable and sustainable reality for mobile, tablet, browser, desktop, and watch across multiple operating systems.

Dirk Garner is a Principal Consultant at Garner Consulting providing data & app strategy consulting and full stack development. Dirk can be contacted via email: dirkgarner@garnerconsulting.com or through LinkedIn: http://www.linkedin.com/in/dirkgarner

Shorten your Analytical Data Supply Chain for Faster Results


2016 will see increasingly widespread popularization of democratized data to serve businesses needs of faster access to data to support mining, exploration and discovery of actionable insight and easier and better tools to do so. Technologies such as streaming data, data virtualization tools, data wrangling tools, and data prep & cleansing utilities will become still more mainstream and easier to use for business users leaving IT staffs to focus more on stability and ‘keeping the lights on’.

Streaming data feeds will become ever more necessary in order for companies to compete. The barriers to entry of streaming are price and expertise and both of these could prove challenging for many companies, especially for smaller enterprises. Dependency on and usage of ETL, data copying and physical re-modeling will begin to wane as the aforementioned tool categories will make it easier and quicker to clean, model, and present data in-place and/or virtually without the overhead and time burden of physically copying and re-modeling it.

With various strategies to gain access to the data faster, business analysts capabilities to analyze sooner will grow progressively and the corresponding effort will become easier as the evolution of hybrid data-blending / analytics products continues. Products such as Alteryx, Looker, and LavaStorm, lessen the skillset required to perform advanced analytics and include many tools to complete the data preparation steps along with visualizing the information.

Data supply chains (the path from production data stores to where the data is stored for analyst activity) can be further shortened through data virtualization products such as Denodo, Rocket Software, or DataVirtuality. Products like these can allow analysts to join queries across physically diverse databases of all different types without the extra steps and time delay of traditional ETL. They can also virtually model, transform, and provide user friendly data element naming. They operate as an intermediary access point and house only the necessary metadata to allow cross database joins. Many of these platforms include advanced query optimization and caching capabilities to provide a more robust toolset.

The increased prevalence of NoSql data stores (Cassandra, Hadoop, Neo4J, etc.) serving production needs will also shorten the data supply chain. These data stores have the capability of storing data in a more analytics friendly manner than traditional relational data stores. With direct or metered access to these types of data stores, when used as production stores, the analysts can act on the most recent data in real time with fewer or no data wrangling steps to slow them down.

Because of all of these new and maturing capabilities there is (finally) a compelling business need for data governance. At least there is a need for data governance in the form of a data glossary or dictionary to help guide and direct analysts to understand and consume appropriate data using standard definitions of data elements, KPIs, metrics, business terms, etc. Data governance is an enabling component to fully democratized data.

We are heading towards a world in which increasingly greater numbers of insights will be discoverable and retrievable in near real time since the events that feed and shape our KPIs and metrics are unfolding at breakneck speed. As we shorten our data supply chain we hasten our ability to analyze and act on insights.

Dirk Garner is a Principal Consultant at Garner Consulting providing data strategy consulting and full stack development. Dirk can be contacted via email: dirkgarner@garnerconsulting.com or through LinkedIn: http://www.linkedin.com/in/dirkgarner

Accelerating Insights: Agile BI Through Rapid Prototyping


Accelerating Insights:  Agile BI through Rapid Prototyping

Accelerating Insights: Agile BI through Rapid Prototyping
Dirk Garner

The Delayed Value Dilemma
BI projects are commonly delivered through a waterfall approach wherein each of the primary project phases (analysis, requirements, design, build, test, etc.) are executed sequentially, one after the other, generally resulting in a lengthy delivery cycle of 6-24 months or more. A typical BI deliverable may be integrated/modeled data, reports, dashboards, or visualizations. Project management in the waterfall approach emphasizes delivery of an end-product and adhering to the timeline. This approach requires numerous variables to be considered and accounted for in the timeline, with feedback loops generally only coming into play during QA and UAT. The objective of finding actionable business insight is not typically considered as a time bound objective in the waterfall approach and is not typically a line item in the project plan.

In the waterfall approach, it is not until the delivery phase that the business can begin exploring and mining the data for actionable insight. In other words, the very thing we need from a BI project — actionable insight — is not remotely possible until the very end of the project. (Although, the first business view of the data may happen during the UAT phase, depending on whether live production data is used, versus mocked-up or de-identified data.) From the delivery team’s perspective, the project is completed once the project deploys, but from the business’ perspective the work has just begun at that point. This is clearly a misalignment of objectives among the business and technology. The business is asked to engage heavily at first to define requirements and is then instructed to withdraw while technology builds to meet those requirements. The business is then expected to jump back in for UAT and provide project sign-off before being able to mine the data for potential business value in hopes of finding actionable business insight. And just then, when the business is ready to roll up their sleeves and get to work, the technology team typically ramps down leaving at best a skeleton crew to support the business’ mining efforts. So as a result, the very reason we started the project (the finding of actionable insight) is left with little or no participation and/or support from technology and rarely is there a funded team available to iterate and refine with the business team.

Once the business does get to work in their newly delivered BI playground, they tend to discover that the product that was delivered does not meet their requirements for any number of possible reasons; the requirements documented were not what was actually desired, the business didn’t know what they wanted so long ago, the requirements changed over time, the original need for the BI has passed so it is no longer relevant, etc. It is at this time, after seeing and working in the deliverable that the business is best prepared to provide valuable feedback to technology regarding the requirements, design and deliverable(s). These insights would have been invaluable during the now ended activities of analysis, design, and development, but at this late stage of the project it is unlikely that there is sufficient staff or funding to do anything with that feedback. It is here that the business is most likely to be discouraged and determine that the BI project was a failure, was a futile effort, etc. The business may express their dissatisfaction in any number of ways and the technology team is typically left wondering what went wrong and why the business isn’t happy. Technology will feel that they fulfilled their obligation by building to meet the business requirements. The business will feel that technology doesn’t understand their needs. Worst cases include finger pointing, name calling, or worse; and all of those months of development work are very likely headed to the data scrap dump.

How could we approach BI projects more effectively? How can we realize the value of BI projects quicker? How do we bring the business and technology together to work collaboratively throughout the life of the project and work in synergy through feedback loops?

What about Agile? Agile is a powerful approach to any development project and is expected to infuse the value of feedback loops into projects to evolve the requirements towards the ideal end-state. However, Agile alone can’t solve the data-specific problems encountered in BI projects.

Defining the “Real” Deliverable
Just as the deliverable in the waterfall example above is clearly defined, albeit somewhat ineffective, in Agile BI we should define the deliverable to be the value the business gains from finding actionable insight discovered in the data. In other words, the objective of a BI project is not to build a data model, report or dashboard but rather to derive business value in the form of actionable business insight mined from the data, report or dashboard. This shift in objective definition causes us to view expectations and execution approach from different angles and in different contexts. Using this shifted approach; technology can now march alongside the business towards the common goal of providing opportunities to find actionable insight. This is a completely different mission from developing code to meet requirements by specified due dates. With this Agile BI approach there are still dates by which certain benchmarks are expected to be met, but the emphasis is now primarily on two things: refining business requirements and providing opportunities for the business to discover actionable insight.

Providing Opportunities – Rapid Prototyping
The key is to allow the business to have access to the evolving product as it is being developed and obtain feedback incrementally to evolve and shape the deliverable as it is being built. Employing the principles of rapid prototyping is an excellent approach to meeting this core need. The idea of rapid prototyping is to generate a prototype as quickly as possible in tandem with the business partner’s ability to articulate requirements. Requirements do not need to be complete; in fact it is better to begin prototyping with a few basic requirements. And, after refining those first few requirements, move on to layer in new requirements, and so on. There does not need to be a predefined order to layering in requirements. It may feel disorganized. It may even feel sloppy. But in practice, the refining of requirements happens much quicker with this approach. Also, since reviews are done targeting small areas of change with greater attention to detail, a higher quality of requirements can be expected.

At first, the idea is to get the prototype in front of the business as rapidly as possible with little concern to quality, completeness, or correctness. Those will all come in future iterations. The sole purpose of the initial prototypes is to coalesce all project participants to a common understanding of what is being pursued. The visual representation of this common understanding; whether it is a report, dashboard, or data model, is then subsequently revised, reviewed, and so on.

The less time technology spends on building each prototype, the less time is potentially lost and the less work is potentially thrown away. So in light of that, efforts should be focused on making small changes, gaining feedback, making more small changes, etc. This progressively increases the quality and completeness of the requirements faster than trying to imagine the entire finished product at the outset without any manner to visualize the result or sort through various ideas. For this reason, short cycles work best since the output is reviewed after a smaller number of changes have been made; those changes get a more thorough review by the business, and based on the feedback, quicker remediation efforts for technology enable the next prototype to be available sooner so the cycle repeats.

It is important to emphasize that the feedback loops are safe zones for discussing how far or how close we are to what is needed. Successful rapid prototyping critically needs honest, direct, and quick feedback. Fostering a culture based on principles of collaborative partnerships helps in abundance to establishing friendly and safe zones to gain the honest direct feedback. The only bad feedback in this case is that which is not shared. Care must be taken to manage expectations, feelings, drive, and motivation here to ensure that everyone is expecting both positive and negative feedback and that it is a good thing and will help get to the end state faster.

There are many reasons that rapid prototyping works well to extract and refine requirements. Among those reasons are that it is generally more effective to “tease” out ideas and thoughts than it is to expect someone to be able to list out all of the things they can think of. Prototyping does just that. Having an example at hand, either literally or figuratively, sparks memories, thoughts and ideas that may not be considered without the mental prompting the prototype provides.

Getting to Actionable Insight – Progressively Increasing Value
There is a natural progression to the feedback cycles that can be expected. At first, the feedback from the business is likely to be highly critical and will point out all of things that are incorrect about the prototype. There will be little or no “good” or “usable” parts of the model, and there will many suggestions of what “should” be. But, as the iterations proceed, there is a clear progression that comes to pass.

As requirements become more complete and refined, each new prototype improves in quality, completeness and correctness, and some or all defining characteristics of the underlying data model become clear: data granularity, KPI definition, and the schema approach. During this progression, the team will want to layer in a new objective in each subsequent prototype. This new layer should be a deliberate target of completing an area or areas of the desired end product, whether it is a report, dashboard, data model, or visualization. The targeting approach should be discussed and planned collaboratively so as to maximize the opportunities to find actionable business insight within the completed area(s). For example, if the end deliverable is an integrated model of data to be mined by the business end user, you may choose to complete the model in an area represented by a table or group of tables for which the business has the most curiosity, has the biggest problem, etc. Technology and architectural considerations can also be determining factors regarding which parts of the final deliverable are candidates to be finished independently from other components of the whole.

This approach enables the opportunity for having two distinct feedback loops. The first is the one described above in which technology issues prototypes and the business, most commonly a business analyst, reviews and provides feedback to technology. The focus of this loop is on establishing and refining the requirements of the end product and is the typical feedback loop involved in rapid prototyping. The second feedback loop is where the first opportunities to find actionable business insight arise. The second loop can begin once part of the final deliverable is completed and ready for the business. There are two significant differences in the second feedback loop as compared to the first. The first difference is the introduction of the end business user who acts as reviewer and feedback provider. In the second cycle, the business analyst who has been participating as reviewer and feedback provider to technology is now also in the role of feedback collector for the end business consumer. A product manager may also participate in this second feedback loop as a process and subject expert and also as a protocol shepherd who can manage expectations.

Prototype Feedback Loops
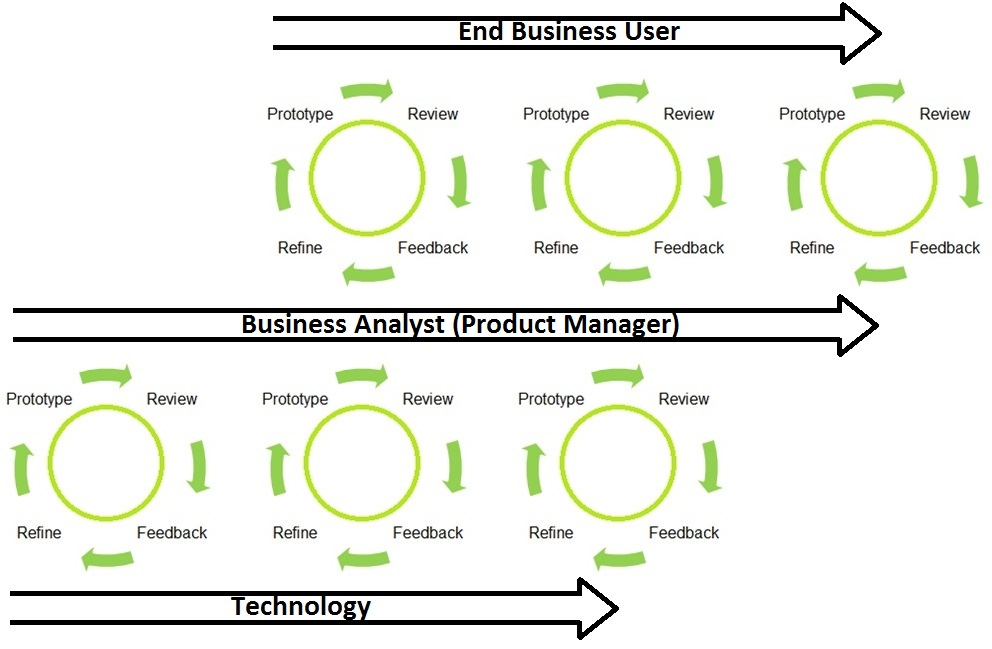
Figure 1. Prototype Feedback Loops

The roles in this second feedback loop are shifted closer to the business. In fact the primary role is that of the business end user, which may be a report consumer, data scientist, data miner, etc. This end business consumer begins reviewing and analyzing the data provided in the finished components of the end deliverable but not the whole product. Parts of the whole product are still under development and are not ready for this business-ready analysis. Care must be taken to clearly demarcate and socialize what is and what isn’t considered business-ready. The business end-user can review, analyze, test, mine, etc. the partially delivered product. Ideally, these opportunities to see the product evolve will provide opportunities for the end user to find relevant insights.

This double feedback loop helps further refine requirements, course-corrections if needed, and commences opportunities to find actionable business insight. Using this approach, insights can be mined simultaneously as the end deliverable continues to evolve. This is how we bring about business value sooner in the BI process.

Progressive Transition of Value in Agile BI with Rapid Prototyping
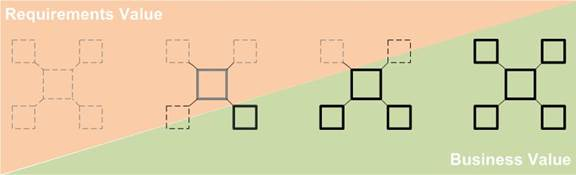
Figure 2. The Progressive Transition of Value in Agile BI with Rapid Prototyping

In the diagram above, the orange triangle represents the progressively increasing completeness and quality of requirements and therefore the decreasing time and effort spent during each feedback loop. The green triangle represents the progression of the evolving completeness of the end product and growing number of opportunities for finding actionable business insight.

When Are We Done?
Teams can be confused about what ‘done’ means using this approach. After all, there are no time bound deliverables so how do we know when we are done? The feedback loops, or iterations, can continue until a specified goal is obtained. Specific goals might be: a report or dashboard is complete, data from disparate data sources has been cleansed, transformed and integrated into a common data model for mining, a target amount of business value has been obtained, funding runs out, time runs out, or the team can agree to proceed until they feel that there is no further value expected remaining in the specific area being researched, or until principles of diminishing returns no longer justify further effort.

Productionalization
In cases where the business has found sufficient ROI and value from the efforts, there may not be anything needed to be built in a robust, stable ‘productionalized’ manner. Thus, all of the prototyping in the iterations can be performed more rapidly with a wireframe, straw man approach without spending time or effort on making it production-ready.

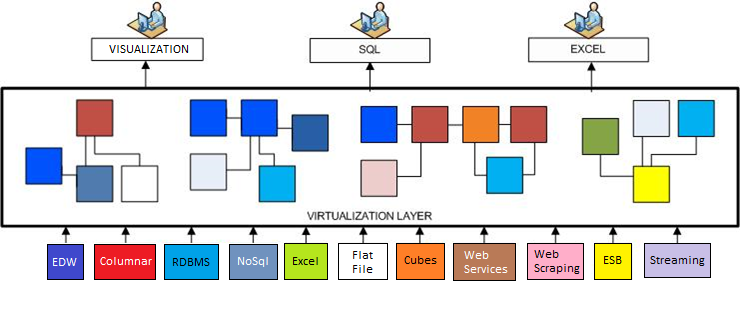
In cases where business objectives warrant the productionalization of reproducible ETLs, reports, dashboards, etc., a parallel planning effort is recommended. This planning, and subsequent development effort, is likely to be more protracted than the feedback loop cycles but is necessary to allow sufficient time to productionalize supporting architectural components. The planning and subsequent build can and should run in parallel to the feedback loops so as not to impeded progress or slow down the feedback cycles. Separate technology teams could be used, but threading the work through the same team provides the highest degree of continuity and the best results. This effort should focus on building what will ultimately become the fault-tolerant rugged product that can be relied upon day after day and should incorporate scalable architectural principles as appropriate. The use of a robust data virtualization platform can be of great value and can streamline this process by acting as not only the prototype but also through the use of caching and automating ETL work it can help deliver the final product will very little additional effort.

An example of an evolution from a raw prototype to final production-quality deliverable follows: Delivering data rapidly and with agility can be as simple as hard coding data in the presentation layer for initial prototypes. This might be mocked up data, screen shots, even whiteboard drawings. As the process progresses, you might pull the data from a service in which the data is hard coded within the service. Next step might be to pull data from a service that consumes data from a database in which the data is mocked up, manually entered, or manually integrated. And finally, as requirements become known, and productionalization is imminent, complete the end to end architectural and development approach and delivery process. The guiding principle is to evolve your architectural and development approaches as the requirements of the end product evolve so as not to generate throw away work, accumulate technical debt and to ensure best alignment of solution architecture to the end deliverable.

Adoption Challenges
Any new process, procedure, language, etc. can be expected to be met with anxiety, skepticism, discomfort, reluctance, resistance, or sometimes outright defiance. Socializing the value to the organization, the benefits to the team, and the benefits to the individuals are key factors to driving adoption.

Benefits, value, and drivers for the use of Agile BI with Rapid Prototyping:
-Better quality requirements
-Quicker establishing of requirements
-Quicker valuable insights
-Quicker ROI
-Increased business partner satisfaction
-Less long term throw away work
-Better team collaboration

Establishing a positive message emphasizing the benefits of the process and subsequently socializing that message consistently, thoroughly, and repeatedly is essential to driving adoption. Coaching a team new to rapid prototyping will require consistent attention and focus at least up until the point at which the team has self-organized and is driving forward independently. As new team members join projects, training, on-boarding, and re-socialization will be necessary to keep the culture and dynamics of the team focused on the agile/rapid paradigm. This on-boarding can and generally is performed by the existing team members.

The technology team may have and may express concerns such as a fear of a new, unknown, unproven approach, or their dissatisfaction with the idea of throwing away (prototype) work, or their discomfort of delivering partially completed work, or the difficulties in providing data with agility and in a rapidly, evolving manner. Producing non-productionalizable, non-sustainable, and hard coded deliverables can cause discomfort and confusion to technology teams. Emphasizing the benefits of using the agile/rapid approach and that a collaborative partnership jointly focused on finding actionable business insight is the best way to serve the business objectives helps foster the best perspectives in these regards and helps brings teams into alignment and build synergy.

Data specific challenges in rapid prototyping may also impede technology team’s willingness to adopt the approach. Leveraging agile/rapid approaches to data delivery can be very effective and assists in delivering prototypes to the business rapidly without generating a lot of wasted effort or creating technical debt. Rapid data delivery can be accomplished much like the approach to rapid code development or rapid GUI development. The objective is to deliver the minimum data required to get the point across with as little effort as possible knowing that there is likelihood that the feedback collected may change directions entirely. For this reason it is not prudent to spend much or any time creating data delivery solutions. Eventually, there may be the need to productionalize the end deliverable. But until we know what data the business wants, how they want to see it, how data will need to be modeled, technology teams should only architect and build minimal solutions, as needed, to deliver the prototypes. In this manner, the architecture evolves incrementally, with agility, and with flexibility to ensure best overall alignment with the end deliverable.

Project Managers might feel a little lost in Agile BI without the familiar concrete benchmarks to drive the team by and towards. The project manager’s deliverables in Agile BI are abundant but very different from those in a waterfall approach. The project manager will be establishing and maintaining the iteration schedule by which the technology team builds and delivers prototypes and the business analyst reviews and provides feedback thus launching another feedback cycle. Additionally, the second feedback loop will cause the project manager to duplicate efforts in tracking and keeping the two feedback loop teams on track and on schedule. Added to these responsibilities is process socialization and expectation management specific to the use of Agile BI and rapid prototyping. The project manager will also be responsible for shepherding the development teams, who are likely to be less heads-down performing development work and will be more focused on capturing and implementing innovative ideas.

In adopting Agile BI and Rapid Prototyping principles, business analysts may struggle with the idea that they need to review something known to be imperfect. Just as with the technology team, fostering the collaborative partnering environment with repeated emphasis on the benefits of using the agile/rapid approach will help drive adoption and set expectations and perspectives.

The end business consumer’s expectations and understanding can determine whether the use of Agile BI will or will not be successful. The end user is likely to be confused by what technology is doing and why. Further, it is unlikely that they would be able to accept the idea that there is value in reviewing anything without complete and accurate data. It is for this reason that the business analyst participates in the primary feedback loop on the business’ behalf. The challenges of engaging the business with rough prototypes seem far too great to overcome and tend to lead to unnecessary churn instead of productive feedback loops.

A challenge that is worth addressing is to introduce the end business user to the partially completed end product in the second feedback loop. There will still be confusion and pushback. But having part of their deliverable much earlier than expected and being able to begin to working within that deliverable to find valuable insight should help replace the confusion and resistance with motivation and engagement. It is best that the business analyst and/or product manager, shepherd the end business user through the process of working with a partially completed deliverable. Expectations, guidelines, training, and edification are all likely to need consistent, repeated socialization to avoid confusion and ensure the most effective use of the deliverable.

Care should be taken in how the end business user is introduced to the partially completed deliverable. A broad landscape view of the evolving end deliverable is helpful to set context of where and how this partially completed deliverable fits into the whole that continues to evolve. Here is where a product manager role could be of most value. The product manager can tie all of the components to the broader whole of the end deliverable and also map the whole to the components and most importantly to the primary objective of finding actionable business insight.

Predicting how well or how poorly your technology and business teams may acclimate to agile and rapid is difficult. One bad apple can bring this approach to a screeching stop and experience has shown that it may be necessary to swap out role players who were unwilling or unable to transition from a waterfall to an agile/rapid approach. In my experience however, once teams have participated in an agile/rapid project and have personally realized the benefits, they are not only ready to participate again but can and do help evangelize and edify team members who are new to the concept.

When to Use Agile BI with Rapid Prototyping
This Agile BI with Rapid Prototyping approach is most effective when used in exploration and discovery projects where it is typical to have a need to acclimate to and maneuver within unfamiliar and frequently undocumented data. It also works exceptionally well for projects involving GUI representations such as a report, dashboard, or visualization. Beyond that, Agile BI with Rapid Prototyping will add value to any project through the acceleration of requirements gathering and the improvement in quality of the requirements.

For projects in which the business begins with a firm understanding of the requirements at the outset, rapid prototyping will have a shorter role in requirements refinement and may not be required at all. Even in these cases, the principles of breaking down the work and delivering through an evolving architecture can provide the opportunity for incremental reviews of progress to facilitate feedback loops, course corrections, and in general help keep projects on track and teams aligned.

In smaller projects, and especially in discovery projects, iterations should be kept short: one or two weeks at the most. In larger efforts, longer iterations are likely to be required especially once the requirements are complete or nearly complete and the heavy lifting of building out infrastructure ensues. Larger projects require longer architectural build time which may necessitate longer iterations providing more time in between releasable prototypes. Incrementally releasing prototypes is still essential to keeping the business engaged, to constantly reconfirm direction and requirements, and continue to provide new and fresher opportunities to find actionable business insight. Also, in smaller initiatives, it is possible for a single resource to serve multiple roles. An example of this might be a Data Architect serving as both Data Modeler and Systems Analyst as well. This in itself has an accelerating effect and can reduce cycle length for prototype releases.

Summary
With the use Agile BI through Rapid Prototyping in appropriate projects, I have observed the highest degrees of business partner’s engagement, satisfaction, and success ratings as compared to any other manner of project delivery.

The following focus points will help maximize success when using this approach:
-Define the objective as “to provide opportunities for the business to discover actionable insight”
-Align teams towards this common goal
-Embrace and support safe-zone feedback loops
-Deliver visual representations of progress (prototypes) in short cycles
-Define and build supporting architecture incrementally as requirements are refined
-Persevere through adoption challenges — it’s worth it
-Increase or decrease emphasis on prototyping depending on the maturity of the requirements


Dirk Garner has a broad technology background spanning 20+ years in data and software engineering and leadership roles including 10+ years as a consultant, focusing on BI, software development, networking, and operational support. He has previously launched and ran a software and systems consulting services company for 10 years and has recently launched a data strategy and full stack development firm. Dirk can be contacted via email: dirkgarner@garnerconsulting.com or through LinkedIn: www.linkedin.com/in/dirkgarner. Please refer to http://www.garnerconsulting.com for more information.

Screen Size for iOS, Android and Windows Phone from C# with Xamarin in Shared Code.

To get the screen size from either iOS, Android, or Windows Phone you could use the following examples:

//ANDROID
int intHeight = (int)Resources.DisplayMetrics.HeightPixels / Resources.DisplayMetrics.Density;
int intWidth = (int)Resources.DisplayMetrics.WidthPixels / Resources.DisplayMetrics.Density;
 
//IOS
int intHeight = UIScreen.MainScreen.Bounds.Height; 
int intWidth = UIScreen.MainScreen.Bounds.Width;
 
//WINPHONE
int intHeight = Window.Current.Bounds.Height; 
int intWidth = Window.Current.Bounds.Width;

To get screen size from any one of the platforms in a shared code base you could include conditional compile directives as follows:

 
int intHeight = 0;
int intWidth = 0;
 
#if __ANDROID__
	intHeight = (int)Resources.DisplayMetrics.HeightPixels / Resources.DisplayMetrics.Density;
	intWidth = (int)Resources.DisplayMetrics.WidthPixels / Resources.DisplayMetrics.Density;
#end if 
 
#if __IOS___
	intHeight = UIScreen.MainScreen.Bounds.Height; 
	intWidth = UIScreen.MainScreen.Bounds.Width;
#endif
 
#if WINDOWS_PHONE_APP
	intHeight = Window.Current.Bounds.Height; 
	intWidth = Window.Current.Bounds.Width;
#endif